UCHI Technology Berhad (UCHITEC) is principally involved in Original Design Manufacturing (ODM), specializing in the design of electronic control system. Uchi designs and develops electronic control modules in-house and eventually manufactures and assembles components into semi finished parts and control modules which its customers will insert into their final products. UCHITECH module are used in fully automated coffee machines, precision weighing scales, centrifuges and deep freezers).
UCHITECH has two operating site
UOM situated in Malaysia is the main operating plant (>85 % Utilisation as of 2019 annual report)
Uchi Donggguan in Dongguan City, Guang Dong Province China, is the assembly arm of UOM. (<75 % Utilisation as of 2019annual report)
UCHITECH consists of three operating segment which are:
Investment holding (includes management services)
Manufacturing of real time centralised energy measurement and control system, high precision hot fluid temperature control system and ultra low temperature and mass sensing control system for bio-chem equipment, touch screen advance display, high precision light measurement (optoelectronic) equipments, mixed signal control system for centrifuge / laboratory equipments, mixed signal microprocessor based application, system integration products and electronic modules.
Trading of complete electrical module and saturated paper for PCB lamination.
Of the three operating segments, only the manufacturing segment (70 % of 2019 total revenue)is for the external sales while the two other segments are for inter segment sales.
Income Statement
UCHITEC 5 years CAGR of Nett Profit (8.19 %) is higher than its 5 years CAGR of revenue of 5.13 % mean UNCHITEC might have reduced its operating expense and interest expense over the 5 years. Despite pandemic in 2019 which bad affected the operation of UCHITEC in Malaysia and China on the first half of year 2020, UCHITEC managed to match the 2019 revenue in 2020 and recorded the highest nett profit in 5 years for year 2020. Besides pandemic, the weakening of US dollar would also affect UCHITEC revenue and net profit for the year 2020.
With the recovery of economy in the world for this year, UCHITEC might perform
Balance Sheet
UCHITEC had maintained a high current ratio for the past 5 years. About 80 % of UCHITEC current assets are in cash and short investments. There is a significant drop in cash / current asset ratio from 89.20 % to 74.10 % in 2018 was due to higher interim dividend declared by the management on Dec 2017 which was paid on January 2018.
Asides that, UCHITEC does not have any debt and good will.
Cash Flow
UCHITEC had healthy operating cash flow with a 5 years CAGR of 8.94 %. Besides that, UCHITEC had 5 years CAGR of free cash flow of 9.95 % mainly due to low capital expenditure. Low investment activities over the 5 years also show in the positive cash flow from investing activities. Since UCHITEC had low or no debt, its cash flow from financing is mainly due to paying dividends to shareholders.
Per Share Analysis
UCHITEC book value per share had dropped significantly due to dividend payout. UCHITEC book value per share had growth from 2018 to 2020.
UCHITEC price had growth at 5 years CAGR of 9.94 % which is faster than its cash flow from operation (8.94 %) and same rate with UCHITEC 5 years CAGR of free cash rate (9.95 %). P/E for 2020 is lower than the 5 years average of 15.86.
Dividend
Aside in 2017 where dividend payout is at 158.55 %, UCHITEC had a dividend payout between 85 % to 97 % for the past 5 years. Besides thatUCHITEC has a dividend yield higher than 10 years Malaysia Government Bond.
Research Report
Only one research house has analysts UCHITEC with the target price of RM 3.88
Peer Analysis
UCHITEC had P/E lower than its peer and dividend yield much higher than its peer which only gave less than 1 % dividend yield.
Technical Analysis
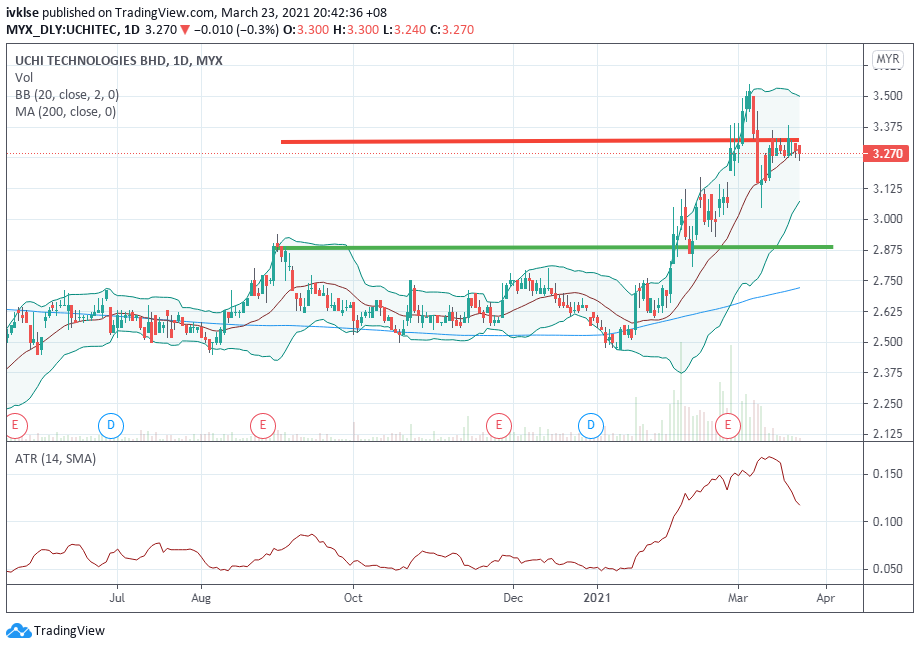
UCHITEC daily chart is testing resistance RM 3.30.
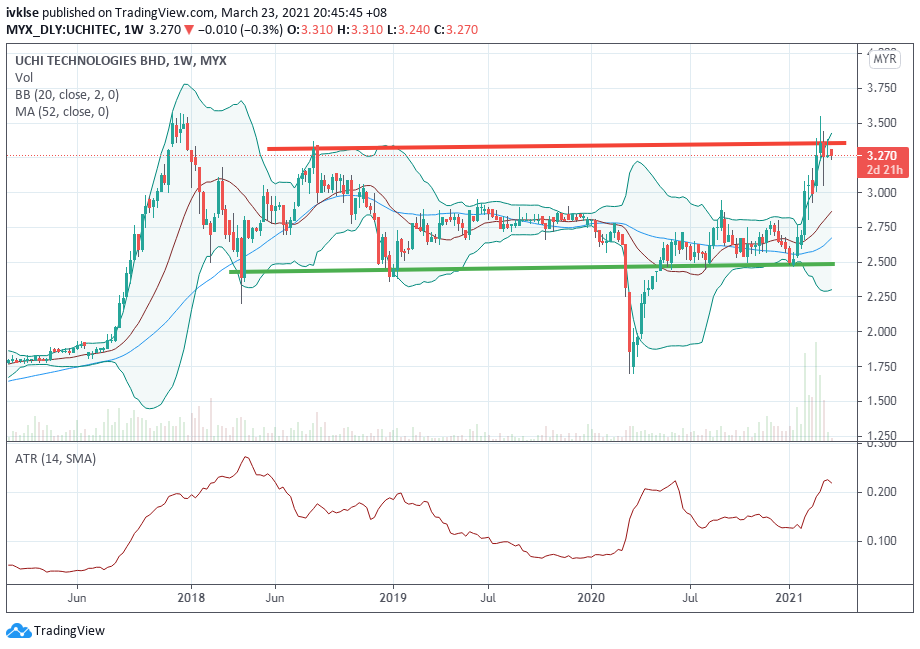
UCHITEC weekly chart also shows a resistance at RM 3.3.