Monday 28 June 2021

Industry Comparison – Port Operation


Sector             : Transportation and Logistics

Sub Sector     : Transportation and Logistics Service

Focus : Port Operation


Industry Review


Base on Linear Shipping Connect Index  (LSCI) which measure the maritime connectivity base on five components annually

  1. The number of shipping lines servicing a country

  2. The size of the largest vessel used in services (in TEU)

  3. The number of services connecting from one country to another country

  4. The total number of vessels deployed in a country

  5. The total capacity of those vessels (in TEU)


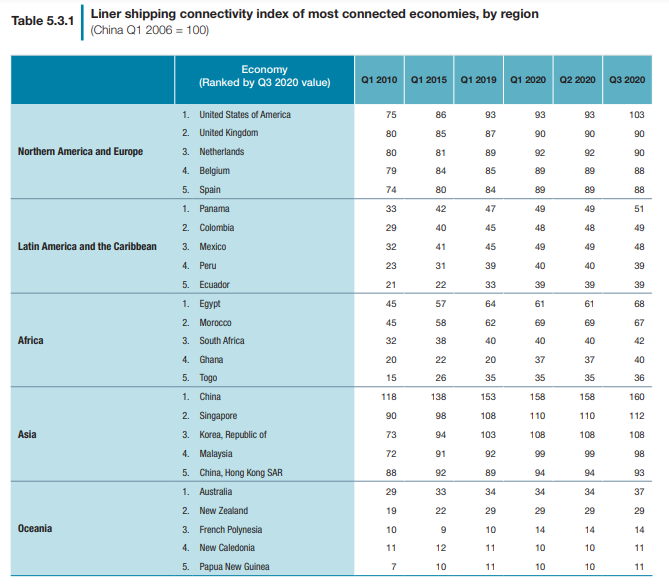
From the table published by UNCTAD, the LSCI around the world does not reduce despite the Covid 19 Pandemic. As of Q3 2020 Malaysia ranked 4th in the Asia region right behind China, Singapore and Korea while ranked 5th in the world behind China, Singapore, Korea and the United States of America.


Malaysia had 3 public listed company listed in BURSA Malaysia which is

  1. Bintulu Port Holdings Berhad (BIPORT) - SARAWAK

  2. MMC Corporation Berhad (MMCCORP) - Straits of Malacca and Saudi Arabia

  3. Westports Holdings Berhad (WPRTS) - Port Klang


Business Diversification


Let look at the business diversification of the company by looking at the percentage of revenue obtained from port operational business.


Company

Revenue 2020 (Port Operation)

Percentage of Revenue (Port Operation)

BIPORT

RM 669,285,000

93.51 %

MMCCORP

RM 3,261,390,000

69.61 %

WPRTS

RM 1,974,968,000

100.00 %


From the table above MMCCORP had the highest revenue for financial year 2020 however MMCCORP had diversified into other business such as, energy and construction instead of just focusing on port operation. Both MMCCORP and WPRTS had operations in port klang while WPRTS had around 80 % of market shares in port klang. MMCORP had operated other ports located in Penang, Johor and Saudi Arabia asides port in port Klang.


BIPORT operated ports in Bintulu, Sarawak with 93.51 % of the revenue are from port operation while the remaining are from bulking service.


Operation


Operational margin ratio is calculated and use as a comparison. Companies with the highest operating ratio have more probability to survive in today's pandemic. The average operational margin ratio of the three companies for 2020 is 33.61 %


Company

Operating Margin Ratio 2020

Operating Margin Ratio 2019

BIPORT

25.52 %

31.82 %

MMCCORP

28.21 %

22.10 %

WPRTS

47.11 %

47.61 %


BIPORT operating margin had affected by the pandemic with a reduction from 31.82 % in 2019 to 25.52 % in 2020 which is 19.80 % reduced while the other two companies are not affected much from the pandemic.


WPRTS had the highest operating margin ratio compared to the other two companies in 2020 and 2019.


Sustainability


For the sustainability of the business, debt of the companies is being reviewed. There are two criteria to look at the interest coverage ratio which is use to determine how easy the companies able to pay off the interest of outstanding debt and debt to equity ratio. The average of interest coverage ratio for 2020  is 5.73  and debt to equity ratio is 0.62.


Company

Interest Coverage Ratio 2020

Debt to Equity Ratio 2020

BIPORT

2.43

0.68

MMCCORP

3.48

0.71

WPRTS

11.28

0.46


WPRTS have the highest interest coverage ratio and lowest debt to equity ratio for the year 2020.


Assets & Liabilities


5 years Compound Annual Growth Rate (CAGR) of assets and liabilities were calculated to make comparison.


Company

5 years CAGR of Assets

5 years CAGR of Liabilities

BIPORT

1.11 %

-1.12 %

MMCCORP

1.52 %

2.15 %

WPRTS

2.52 %

-3.76 %


Summary


From the above comparison WPRTS is worth further detailed analysis.


Wednesday 23 June 2021

Stock Review – REXIT (0106) (REXIT BERHAD)


Bursa Malaysia - 0106
Bloomberg - REXI:MK
Reuters -  REXT.KL
Yahoo - 0106.kl

Sector            : Technology
Sub Sector    : Software
Focus             : Software (Financial and Insurance)

Company Profile

Rexit Berhad (REXIT) is a company that focuses on delivering solutions and services to Financial Service Sector particularly the General Insurance Industry.

REXIT had three product namely:-

  1. e-Cover - Enabling online insurance transaction

  • Provides electronic link between insurance companies and Malaysia Road Transport Department (“JPJ”)

  • Manage and operate the my Salam portal for eligible members, on 29 July 2019 amended agreement was signed to a five year term subject to regulatory authority approval. Initial approval from 1 January 2019 to 31 December 2020 further extension for 2 years after expiry.

  1. e-PPA - Enabling online unit trust investment through EPF

  • Industry platform for submission of unit trust investment and redemption applications which are settled electronically using the EPF member’s contribution.

  1. InfoGuardian - Enabling online legal documentation

  • Is an integrated workflow, case management and document management system specially designed for financial and legal services industries, to provide and facilitate an online information sharing environment for multiple users within and outside customer organication

  • One local bank (RHB Bank) and international bank (Al Rajhi Bank) together with their panel of legal firms and property valuation firms is using the service.

Income Statement


30 Jun 2020

30 Jun 2019

30 Jun 2018

30 Jun 2017

30 Jun 2016

Revenue

25,540,000

22.720.000

21,840,000

20,580,000

18,840,000

Cost of Goods Sales

6,930,000

6,420,000

5,750,000

5,610,000

4,930,000

Earning Before Tax

12,850,000

10,510,000

10,270,000

9,840,000

8,840,000

Nett Profit

9,520,000

7,890,000

7,860,000

7,550,000

6,860,000

5 Years CAGR of Revenue

6.27 %

5 years CAGR of Nett Profit

6.77 %


REXIT revenue and net profit had increased steadily for the past five years. However after look in the 2020 annual report  there is no revenue recognised at the point in time for year 2020. Revenue recorded in the income statement would only be recognised in the future.There is a risk that the customer is unable to pay to REXIT in the future. 


Asides that, 3 major customers had contributed 48.91 % of its 2020 revenue. REXIT is mainly focus in 2 countries Malaysia and Hong Kong, 81.20 % of REXIT 2020 revenue are from customers located in Malaysia while Hong Kong customers contributed 16.43 % of the revenue.


Balance Sheet


30 Jun 2020

30 Jun 2019

30 Jun 2018

30 Jun 2017

30 Jun 2016

Account Receivable

6,204,306

5,250,035

2,734,900

2,520,588

2,641,530

Percentage of Account Receivable Past Due

50.80 %

68.76 %

18.95 %

10.20 %

29.20 %

Current Ratio

4.98

8.31

11.57

10.20

7.84

Cash / Current Asset

65.34 %

82.06 %

90.31 %

89.30 %

88.33 %


In 2019 there is a significant increase in account receivable from RM 2,734,900 in 2018 to RM 5,250,035 in 2019 91.96 % increase mainly due to the My Salam Portal. However the percentage of account receivable past due had also increase to 68.76 % in 2019 from 18.95 in 2018. In 2020, 76 % of account receivable are from 4 major customers.


REXIT had high current ratio and high cash / current asset ratio. In 2020 there is an decrease in cash / current asset ratio mainly because REXIT had invested in other investment which the management would like to hold for a longer term instead of cash fund. For the financial year ending 30 June 2020, RM 17,932,000 had invested into the other investment and only receive RM 63,216 dividend from the investment. Base on Quarter 3 2021 report,  the investment had increase its value to RM 18,775,000, 4.7 % increase. This unrealized gain would be recorded in other comprehensive income hence it would not effect the nett profit of REXIT.


Cash Flow


30 Jun 2020

30 Jun 2019

30 Jun 2018

30 Jun 2017

30 Jun 2016

Cash Flow from Operation

8,780,000

6,020,000

7,850,000

7,140,000

9,500,000

Cash Flow from Investing

-17,730,000

-290,000

540,000

550,000

10,430,000

Cash Flow from Financing

-6,150,000

-6,470,000

-5,770,000

-5,730,000

-4,350,000

Free Cash Flow

8,450,000

5,020,000

7,590,000

6,940,000

9,230,000

5 years CAGR of Cash Flow from Operation

-1.56 %

5 years CAGR of Free Cash Flow

-1.75 %


REXIT had negative growth for cash flow from operation and free cash flow. Asides that, REXIT had constantly repurchased back its own share, in 2020 RM 865,728 had been spent for share repurchase and 15,071,500 shares (7.96 %) are held as treasury shares.


Per Share Analysis


30 Jun 2020

30 Jun 2019

30 Jun 2018

30 Jun 2017

30 Jun 2016

Share Outstanding 

174,260,000

176,000,000

178,100,000

178,660,000

179,250,000

Price 30 Jun

0.585

0.685

0.645

0.865

0.52

BV/Share

0.23

0.21

0.20

0.19

0.18

P/E

10.71

15.28

14.62

20.47

13.59

5 years CAGR of Price 

2.38 %


REXIT had low P/E ratio. REXIT price is 2.54 times higher than its BV.


Dividend


30 Jun 2020

30 Jun 2019

30 Jun 2018

30 Jun 2017

30 Jun 2016

Dividend Per Share

0.03

0.03

0.03

0.03

0.02

Dividend Payout

54,91 %

66.92 %

67.98 %

70.99 %

52.26 %

Dividend Yield

5.13 %

4.38 %

4.65 %

3.47 %

3.85 %

10 year Malaysia Government Bond

3.03 %

3.72 %

4.21 %

3.91 %

3.58 %


REXIT had high dividend yield higher than 10 year Malaysia Government Bond. For financial year 2021 REXIT had pay out RM 0.04 dividend.


Research Report


No recent research report


Peer Analysis


REXIT

APPASIA

CENSOF

EFORCE

P/E

16.35

213.01

10.31

25.03

Dividend Yield

4.47

0.00

1.50

0.85


REXIT has a high dividend yield compared to others.


Technical Analysis


REXIT daily chart shows consolidation at 0.89.


Weekly chart show downward trend with support at RM 0.63.