Showing posts with label industrial products and services. Show all posts

Tuesday, 27 July 2021

Industry Comparison – Packaging


Sector                     : Industries Products and Services

Sub Sector     : Packaging Material

Focus : Packaging


Industry Review


With the Covid 19 pandemic around the world, more and more people would buy their item online. The increasing demand of transportation of goods has also increased the demand of packaging. In Malaysia packaging manufacturing is considered an essential business and allowed to operate with a strict standard of procedure during the movement control order (MCO) announced by the Government of Malaysia from 18 of March 2020. For the year 2020 the packaging exposure business had been affected by the lockdown around the World and compensated by the increasing packaging demand locally in Malaysia.


This article would compare three packaging companies listed in Bursa Malaysia.

  1. BP PLASTICS HOLDING BHD (BPPLAS)

  2. SLP RESOURCES BHD (SLP)

  3. THONG GUAN INDUSTRIES BERHAD (TGUAN)


Location


BPPLAS and SLP only had operations in Malaysia. Where BPPLAS operated in Johor and SLP operated in Kedah. Whereas TGUAN had operations in multiple states in Malaysia and even overseas. TGUAN had operation in Kedah, Perak, Johor, Sabah, China, Vietnam and Myamar.


TGUAN had an operational advantage in the East Malaysia because it had an operation plant in Sabah. Asides that TGUAN had operation plant in other country which enable them to had operation advantage as 41 % of the 2020 TGUAN revenue are from the Asia Country.


Revenue


Company

Revenue 2019

Revenue 2020

BPPLAS

Malaysia

Asia Countries

Others

Total


RM 90,095,106

RM 206,109,601

RM 39,987,151

RM 313,191,858


RM 91,383,589

RM 187,262,030

RM 37,951,878

RM 316,597,497

SLP

Malaysia

Asia Countries

Others

Total


RM 67,059,484

RM 69,425,191

RM 30,364,237

RM 166,848,912  


RM 78,312,704

RM 54,663,847

RM 14,016,223

RM 146,992,774

TGUAN

Malaysia

Asia Countries

Others

Total


RM 185,218,000

RM 423,246,000

RM 330,739,000

RM 939,204,000


RM 238,543,000

RM 385,618,000

RM 336,420,000

RM 960,581,000


Base on 2020 revenue, TGUAN had the highest market share which is 66.18 % followed by BPPLAS which is 22.07 % and SLP 11.76 %. Compared to 2019 revenue, 2020 revenue had reduced except for BPPLAS which its revenue remained the same.mainly due to reduction of export to other countries. The reduction of export revenue had covered by the increase of revenue generated from Malaysia. TGUAN local revenue for 2020 had increase by 28.79 % followed by SLP 16.78 % and lastly BPPLAS 1.43 %.


Both TGUAN and BPPLAS had 70 % of their 2020 revenue from oversea market which were affected due to the World lock down. While SLP only had 46.72 % of their 2020 revenue from oversea markets.


Sustainability


Besides TGUAN which had Debt to Equity ratio of 0.22 and interest coverage ratio of 38.28, BPPLAS and SLP does not have any debt.


Assets & Liabilities


5 years Compound Annual Growth Rate (CAGR) of assets and liabilities were calculated to make comparison.


Company

5 years CAGR of Assets

5 years CAGR of Liabilities

BPPLAS

3.56 %

1.56 %

SLP

6.96 %

8.17 %

TGUAN

10.22 %

13.52 %


TGUAN had the highest growth in asset amongst the three companies. Besides that TGUAN growth of company asset is supported by growth of company liabilities.


Company

Non Current Asset in Malaysia 2020

Percentage of Non Current Asset in Malaysia 2020

BPPLAS

RM 78,704,345

100 %

SLP

RM 75,408,057

100 %

TGUAN

RM 258,134,000

85.54 %


BPPLAS and SLP had almost the same non current asset in Malaysia while TGUAN is more than 3 times their size. Both BPPLAS and SLP had their non current asset in Malaysia only while 85.54 % of the TGUAN non current asset in Malaysia.


With the same non current asset in Malaysia between BPPLAS and SLP both companies shall have almost the same revenue however revenue for SLP in 2020 is RM 146,342,946 or 46.73 % lower than BPPLAS.
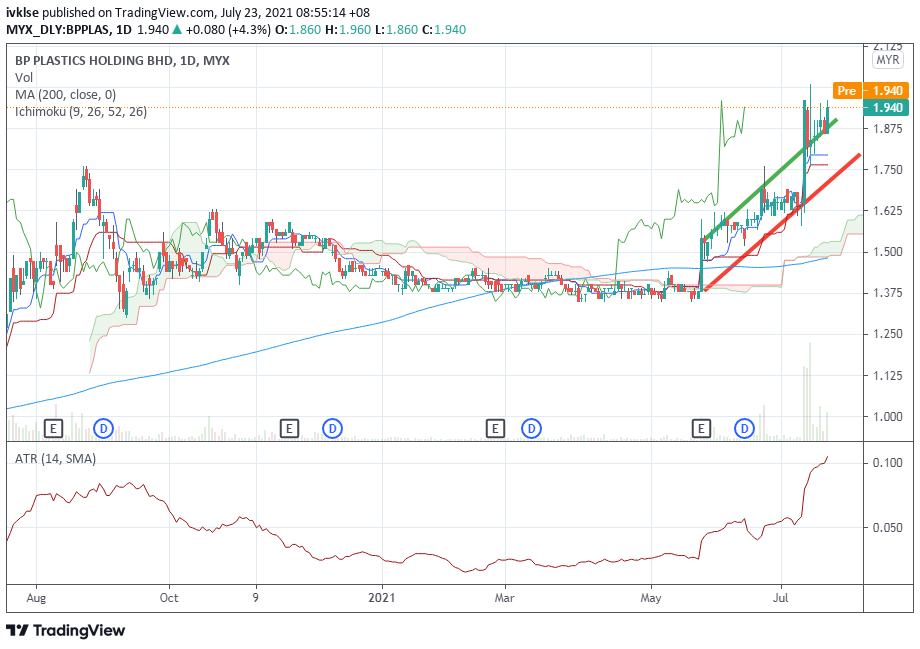
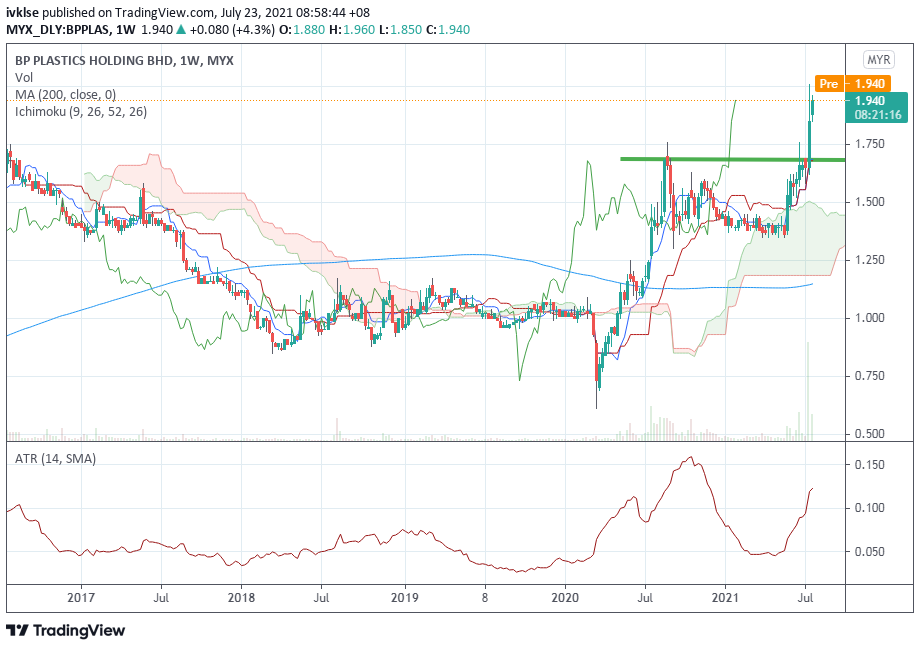
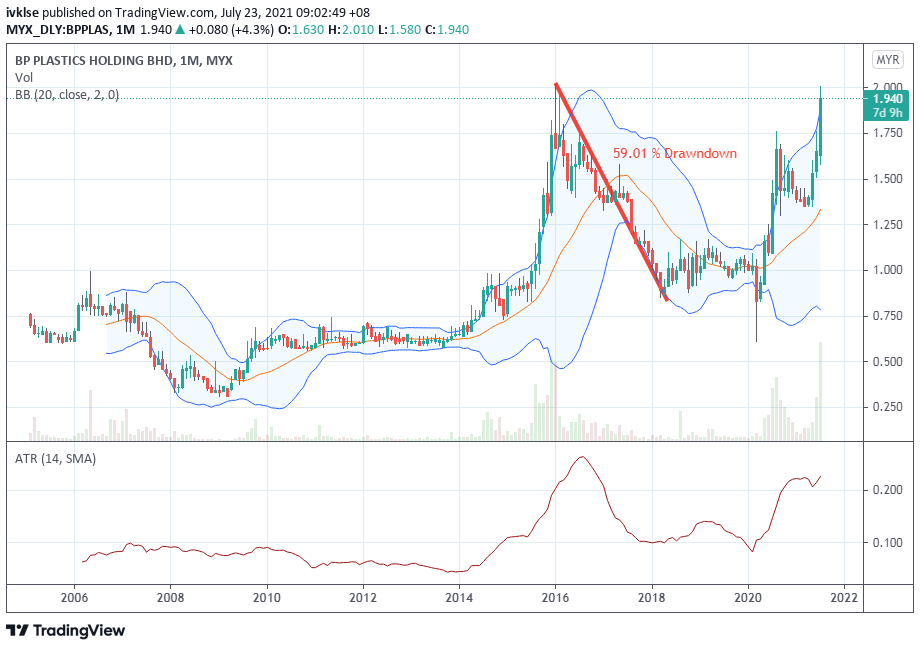

Price Analysis


Description

BPPLAS

SLP

TGUAN

Market Cap (27 July 2021)

RM 339,651,930.00

RM 301,111,999.05

RM 949,504,486.40

P/E

11.42

18.28

11.83

Dividend Yield

4.42 %

5.79 %

1.20 %

Dividend Payout Ratio

50.70 %

105.85 %

14.14 %


From the price analysis BPPLAS had lower P/E compared to SLP which had almost the same market cap and lower P/E compared TGUAN which had three times higher market cap than BPPLAS.


BPPLAS had a high dividend yield of 4.42 % with 50.70 % dividend payout ratio, there is extra cash retained for future extension unlike SLP which dividend pay out is more than the earning for year 2020.


Du Point Analysis


Description

BPPLAS

SLP

TGUAN

Nett Profit Margin

9.35 %

11.20 %

8.36 %

Asset Turnover

1.10

0.68

0.95

Equity Multiplier

1.40

1.19

1.51

ROE

14.39 %

9.06 %

12.01 %


SLP had the highest net profit margin, however it had low asset turnover of 0.68 which had reduced the return of equity, ROE of SLP to the lowest amongst the three.


BPPLAS had the highest ROE of 14.39 % and asset turnover more than 1.


Summary


From the above comparison BPPLAS is worth for further analysis.


Thursday, 22 July 2021

Stock Review – BPPLAS (5100) (BP PLASTICS HOLDING BHD)


Bursa Malaysia - 5100
Bloomberg - BPP:MK
Reuters -  BPPL.KL
Yahoo - 5100.kl

Sector            : Industrial Products and Services
Sub Sector    : Packaging Material
Focus             : PE Films and Bag

Company Profile

BP Plastics Holding Bhd (BPPLAS) is a progressive Polyethylene (PE) Films and Bags manufacturer deploying the latest state of the art machinery with advanced multi layer co extrusion technology that is capable to produce high quality primary, secondary and tertiary packaging solutions for various market segment needs. 

BPPLAS had 2 manufacturing plants located in Sri Gading Industrial Estate of Batu Pahat Johor which able to manufacture 8,100 metric tons per month. BPPLAS main focus is in Asia Countries 59.15 % of 2020 revenue followed by Malaysia 28.86 % of 2020 revenue.

71 % of the BPPLAS revenue and 70 % of purchase cost are in foreign currency  predominatory in US Dollar.


Capital Expenditure


BPPLAS had allocated RM 35,600,000 for CAPEX for the year 2021. BPPLAS is investing in a new 9th Cast Stretch Film machine which is expected to complete by the end of 2021.


Closure of factory due to Convid 19


One of the manufacturing plants was closed down by Kementerian Kesihatan Malaysia (KKM) from 19 March 2021 to 28 March 2021 due to 14 foreign workers had tested positive for Convid 19.

Income Statement


31 Dec 2016

31 Dec 2017

31 Dec 2018

31 Dec 2019

31 Dec 2020

Revenue

324,360,000

328,560,000

333,780,000

331,900,000

316,600,000

Cost of Goods Sales

284,490,000

295,670,000

292,080,000

288,180,000

260,260,000

Earning Before Tax

22,870,000

15,520,000

25,030,000

26,350,000

38,920,000

Nett Profit

17,870,000

12,830,000

21,360,000

21,200,000

29,660,000

5 Years CAGR of Revenue

-0.48 %

5  years CAGR of Nett Profit

10.66 %


Despite the revenue of BPPLAS 5 year CAGR of almost stagnant growth, the nett profit of BPPLAS had growth at rate of 10.66 % over the 5 year. This might be a sign of a cost cost management by the management of the company.


Balance Sheet


31 Dec 2016

31 Dec 2017

31 Dec 2018

31 Dec 2019

31 Dec 2020

Account Receivable

46,043,257.00

39,779,518.00

37,827,936.00

36,904,107.00

36,393,137.00

Percentage of Account Receivable Past Due

22.49 %

33.92 %

25.29 %

24.82 %

19.85 %

Total Debt

0

0

0

0

0

Current Ratio

2.51

3.31

3.89

4.35

2.90

Cash / Current Asset

27.07 %

29.40 %

35.22 %

30.22 %

40.23 %


BPPPLAS trade receivable past due between the range of  19.85 % in 2020 and 33.2 % in 2017 over the past year. BPPLAS had no debt and a high current ratio. BPPLAS had also high in cash where RM 56,825,992 or 67.60 % of cash is in short term investment at 2.52 %.


Cash Flow


31 Dec 2016

31 Dec 2017

31 Dec 2018

31 Dec 2019

31 Dec 2020

Cash Flow from Operation

15,580,000

14,070,000

36,950,000

16,780,000

58,770,000

Cash Flow from Investing

-13,890,000

-2,510,000

-24,480,000

-10,740,000

-4,660,000

Cash Flow from Financing

-16,890,000

-11,260,000

-7,510,000

-11,260,000

-15,010,000

Free Cash Flow

-200,000

10,630,000

11,280,000

4,440,000

52,500,000

5 years CAGR of Cash Flow from Operation

30.41 %

4 years CAGR of Free Cash Flow

49.15 %


BPPLAS has positive growth on cash flow from operation and free cash flow of 30.41 % and 49.14 % respectively. In 2020 BPPLAS had increase it cash flow from operation from RM 16,780,000 in 2019 to RM 58,770,000 in 2020 mainly due to increase of trade payable by RM 34,769,197 two times higher than 2019 trade payable.


Per Share Analysis


31 Dec 2016

31 Dec 2017

31 Dec 2018

31 Dec 2019

31 Dec 2020

Share Outstanding 

187,650,000

187,650,000

187,650,000

187,650,000

187,650,000

Price 31 Dec

1.391

1.093

0.984

1.023

1.441

BV/Share

0.88

0.89

0.97

1.02

1.10

P/E

14.61

15.99

8.64

9.05

9.11

5 years CAGR of Price 

0.71 %


BPPLAS price only grew by 0.71 % for the 5 year despite its free cash flow increase by 49.15 %. BPPLAS had low P/E ratio currently.


Dividend


31 Dec 2016

31 Dec 2017

31 Dec 2018

31 Dec 2019

31 Dec 2020

Dividend Per Share

0.08

0.04

0.06

0.06

0.08

Dividend Payout

84.01 %

58.50 %

52.71 %

53.11 %

50.61 %

Dividend Yield

5.75 %

3.66 %

6.10 %

5.87 %

5.55 %

10 year Malaysia Government Bond

4.24 %

3.94 %

4.01 %

3.33 %

2.68 %


BPPLAS had dividend payout policies to distributed at least 40 % of its profit to its shareholder since 2016. BPPLAS had high dividend yield over the past 5 year higher than 10 year Malaysia Government Bond.


Dupoint Analysis


31 Dec 2016

31 Dec 2017

31 Dec 2018

31 Dec 2019

31 Dec 2020

Net Profit Margin

5.51 %

3.90 %

6.40 %

6.40 %

9.37 %

Asset Turnover

1.34

1.48

1.47

1.40

1.10

Equity Multiplier

1.45

1.33

1.26

1.23

1.40

Return of Equity

10.78 %

7.67 %

11.79 %

11.09 %

14.41 %


BPPLAS net profit margin had increase steady over the five year except in 2017 which the net profit margin is lower due to intense competition and pricing pressure in main exporting market.


Growth Rate


5 year average ROE (AROE)

11.15 %

5 year average dividend payout ratio (ADPR)

59.79 %

Ground Rate (GR = AROE x (1-ADPR))

4 %


GFM had a growth rate of 4 %.


Capital Asset Pricing Model (CAPM)


Beta of BPPLAS

0.56

Risk Free Rate (10 year Malaysia Government Bond)

3.12 %

Expected Return (ROE)

11.00 %

Cost of Equity = Risk Free Rate + Beta (ROE - Risk Free Rate)

7.53 %


Altman Z Score Model


Altman Z Score model is use to predict the chance of business going bankrupt in two years. BPPLAS had a Z score of 5.21 in 2020


Z Score

Zone

< 1.8

Distress Zone (Likely to bankrupt)

1.8 to 3.0

Uncertain Zone

> 3.0

Safe Zone 


Research Report


Investment House

Date

Target Price

KENAGA INVESTMENT BANK BERHAD

12 July 2021

RM 2.50

Average Price Target


RM 2.50


Peer Analysis 


BPPLAS

TGUAN

SLP

P/E

11.00

12.35

16.47

Dividend Yield

4.12

1.79

5.76


BPPLAS is trading at 12% discount from TGUAN P/E and 49 % discount from SLP P/E.


Technical Analysis


BPPLAS daily chart show an upward trend.

BPPLAS weekly trend shows an upward trend with a support level of RM 1.67.


Maximum drawdown for BPPLAS is 59.01 %.


KLSE Personal View

  • Convid 19 had increased the world logistic demand hence the demand of PE films and Bag had increased.

  • BPPLAS provides PE films and  bag for food and beverage which is essential business hence its manufacturing plant is able to operate during Movement Control Order with compliance of SOP set by the Government of Malaysia.

  • Since 71.14 % of BPPLAS revenue are from export, the increasing of container cost over the world after convid 19 might affect the profit of BPPLAS.

  • BPPLAS had nett currency exposure of US dollar of - RM 27,538,255, strengthening of USD after March 2021 would decrease the profit of BPPLAS.

  • Investment on the new 9th Cash Stretch Film Machine expected to be completed by the end of 2021.

  • One of the manufacturing plant had close down for 10 day on March 2021 due to Convid 19 cases. This might affect the production and revenue of BPPLAS.

  • BPPLAS had low growth in revenue over the 5 year period however its net profit is growing at 10.66 % which indicated the management had done well in cost management.

  • Despite pandemic BPPLAS manage to control its trade receivable past due at 19.85% in 2020.

  • BPPLAS has no debt and is cash rich. 67.60 % of the 2020 cash balance is in a short term investment fund earning interest of 2.52 %.

  • BPPLAS had increase its trade payable from RM 34,163,325 in 2019 to RM 68,582,231 in 2020 mainly due to increase of their purchase in raw material in 2020. BPPLAS manages to purchase more raw material in 2020 when the raw material price is low. There is less concern on the increase of trade payable because BPPLAS had RM 84,0466,187 in cash and short investment which was able to pay their supplier.

  • BPPLAS is trading at 12% discount from TGUAN P/E and 49 % discount from SLP P/E and has a dividend yield higher than 10 years Malaysia Government Bond over the past 5 years.

  • BPPLAS current price is at upward trend.