Company Profile
Bursa Malaysia Berhad (BURSA) is an exchange holding company. Bursa Malaysia is home of the largest Public listed companies in ASEAN. BURSA operated in four segments as follows
i) Securities Market
This segment mainly comprises the provision and operation of listing, trading, clearing, depository service and provision and dissemination of information relating to equities security quoted on the security exchange.
ii) Derivative Market
This segment market mainly comprised the provision and operation of trading, clearing, depository services and provision and dissemination of information relating to derivative products quoted on derivation exchange.
Crude Palm Oil Futures price which trade in Bursa Derivative exchange is used as the benchmark for globally crude palm oil price.
iii) Exchange Holding Business
This segment function as investment holding company
iv) Other
This segment comprise of Shariah compliant commodity trading platform, a reporting platform for bond traders and the provision of exchange for the offshore market
Income Statement

BURSA revenue mainly depends on the average daily volume from 2016 to 2020 correlation between revenue and the average daily volume is 0.99. From Q1 2017 to Q4 2020 correlation between the two is 0.98.
BURSA has fixed operating cost, aside Q4 2020 which had operating cost of RM 85,650,000 BURSA had an average operating cost of RM 56,147,800 from Q1 2017 to Q3 2020. BURSA had an average effective tax rate of 25.27 % from 2016 to 2020. Q4 2020 impose higher operating costs due to higher professional fee and one off SST provision.

Most BURSA revenue from securities market segment, 84 % in 2020. BURSA revenue from the securities market increased from 73 % in 2016 to 84 % in 2020.
Balance Sheet
BURSA trade payables comprise derivative trading margins, equity margin and security deposits from Clearing Participants of Bursa Malaysia. An increase in trade payable show an open interest in bursa derivatives and equity. BURSA Cash / Trade Payable ratio is more than one which means BURSA is capable of paying all trade payable if the open interest had decreased.
BURSA had a current ratio of more than one from 2016 to 2020. BURSA current assets is lower than current liabilities. BURSA intangibles had decreased from RM 47,110,000 in 2016 to RM 33,330,000 in 2020.
Cash Flow
BURSA had significant cash flow from operation and free cash flow from 2016 to 2020. BURSA had high cash flow from financial activities compared to cash flow from operating activities from year 2016 to 2019. Most of cash flow from financial activities are for payment of dividends to the shareholders. Since BURSA does not required much expansion most of the cash from operating activities would distributed back to the shareholders.
Dividend
BURSA had pay dividends for more than 10 years without failure. Over the years, BURSA had announce dividends at least twice a year.
Aside from 2019, BURSA has a dividend payout ratio of more than 100 %. Unlike most companies which require retained earnings for future investment, BURSA is an exchange holding company that does not need much CAPEX investment.
BURSA dividend yield is higher than Malaysia 10 years Bond for the past 5 years.
Per Share Analysis
For year 2020, BURSA had low P/E as compared to the past 4 year average of 23.88. On average BURSA price is about 6.65 times its book value. In 2020 BURSA P/BV is higher than the average.
Research Report
Average analyst target price is RM 10.20.
Technical Analysis

Since September 2020, BURSA Daily Chart shows the price is trading around RM 8 and RM 9. Besides that BURSA had traded above 200 moving average since May 2020.
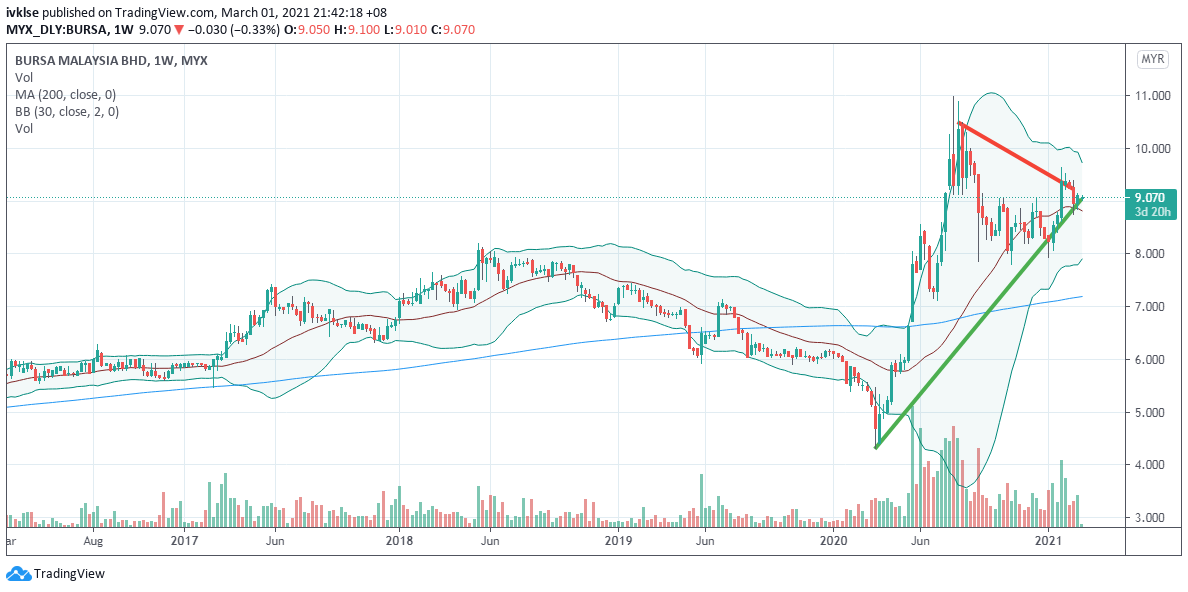
Weekly chart shows symmetrical triangle converge into RM 9.00. From both the daily chart and weekly chart RM 9.00 is providing a strong resistance level for BURSA.
Peer Analysis
No comments:
Post a Comment