Company Profile
Westports Holding Berhad (WPRTS) primarily manages port operations dealing in container and conventional cargo. Westports is located in Port Klang and it is one of the three main ports in the Strait of Malacca. The other two main ports are in Penang and Johor which are operated by MCC Corporation Berhad which is currently undergoing selective capital reduction (privatisation).
WPRTS is granted a license to provide port service with the Government of Malaysia and Port Klang Authority until the year 2054.
Despite Convid 19, Westport was able to maintain its container throughput in 2020 and increase its conventional cargo throughput by 1,000,000 tonnes, 10 % increase. WPRTS do not meet it mission of 12 millions TEUs and 12 million tonnes by 2020 as stated in the 2017 annual report.
Income Statement

WPRTS revenue had drop significantly mainly due to revenue classification in accordance with MFRS 15. Other than that, the revenue of WPRTS had increased steadyly. From 2018 to 2020 WPRTS revenue had increase at a CAGR of 6.94 %. WPRTS also had a consistent net profit margin of 33 % from 2018 to 2020. 12 % of 2020 revenue or RM 235,305,000 is contributed from one major customer.
Balance Sheet
WPRTS had concessions to provide port service until 2054 hence RM 2,468,069,000 or 46.91 % of 2020 total assets. Percentage of Account Receivable past due had dropped from 41.61 % in 2018 to 31.19 % in 2020. WPRTS has a high current ratio of 1.58 and high cash reserve which is 73.33 % of the current asset is cash.
WPRTS had Debt to equity ratio of 0.48 which is lower than its industrial average of 0.62. WPRTS has repayment of Sukuk Musharakah Medium Term Bond (SMTN) of RM 1,150,000,000 where RM 575,000,000 is from 2021 to 2024. In 2020 WPRTS has RM 779,123,000 in cash and short term investment which is sufficient to pay the repayment up to year 2024. Asides that the SMTN hold by WPRTS has an interest rate between 4.15 % to 5.38 % which is high compared to the current 10 year Malaysia Government Bond of 2.68 % only. Currently WPRTS is able to issue new SMTN with a lower interest rate.
Cash Flow
WPRTS has a 5 years CAGR of cash flow from operation is 1.77 % and 5 years CAGR of free cash flow is 9.38 %.
Per Share Analysis
WPRTS had low book value as 46.97 % of the assets are concession assets which are identified by intangible assets. WPRTS 5 years CAGR of price is 0 % although its 5 years CAGR of free cash flow is increasing by 9.38 %. Despite revenue reclassification in 2018, WPRTS P/E is lower in 2020 compared to 2016 which had the same price.
Dividend
WPRTS dividend yield is lower than the 10 years malaysia government bond. Asides that WPRTS had a high dividend payout of around 75 % except in 2020 dividend payout is 60.02 %.
Research Report
No recent research report
Peer Analysis (Port Operation)
WPRTS had the same dividend yield compared with other port operators in Malaysia. However MMCCORP had lower PE compare to WPRTS and BIPORT mainly because MMCCORP is in a more diversify business only 70 % on revenue for MMCCORP are from port operation.
Technical Analysis
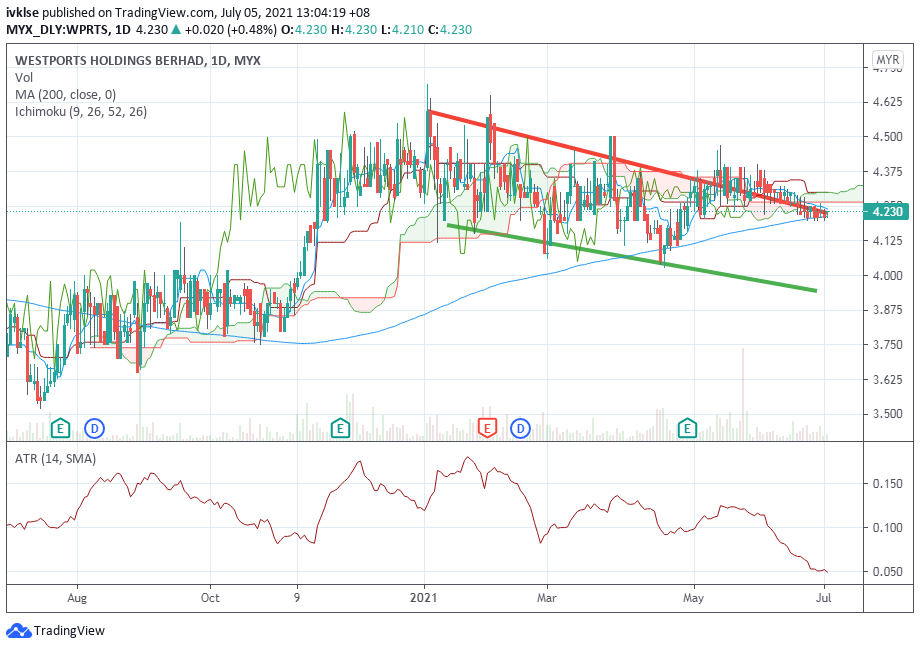
WPRTS daily chart show a downward trend.
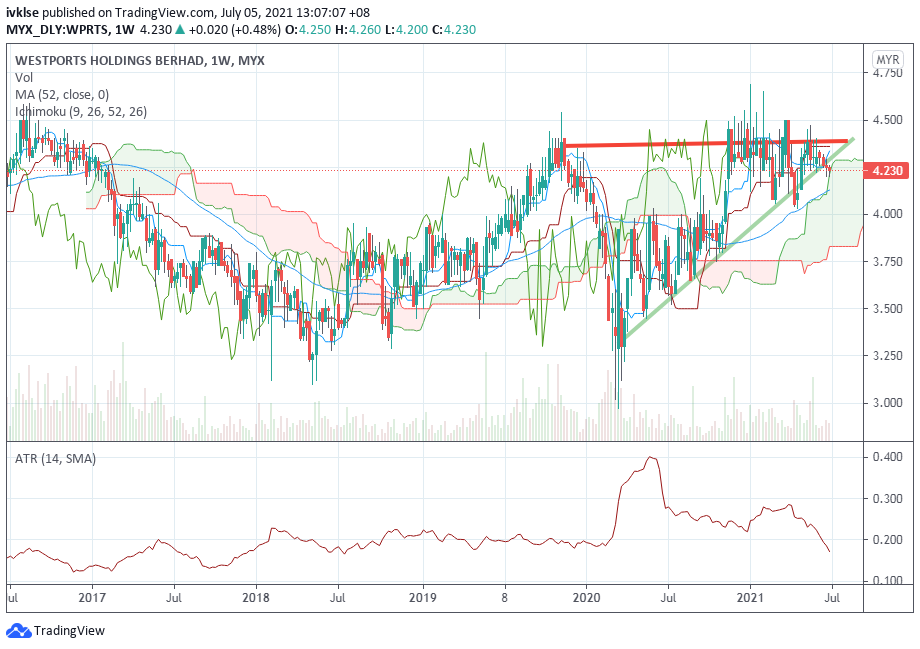
Weekly charts show an upward trend forming an ascending triangle. The breakup point would be RM 4.4 for the trend to continue.
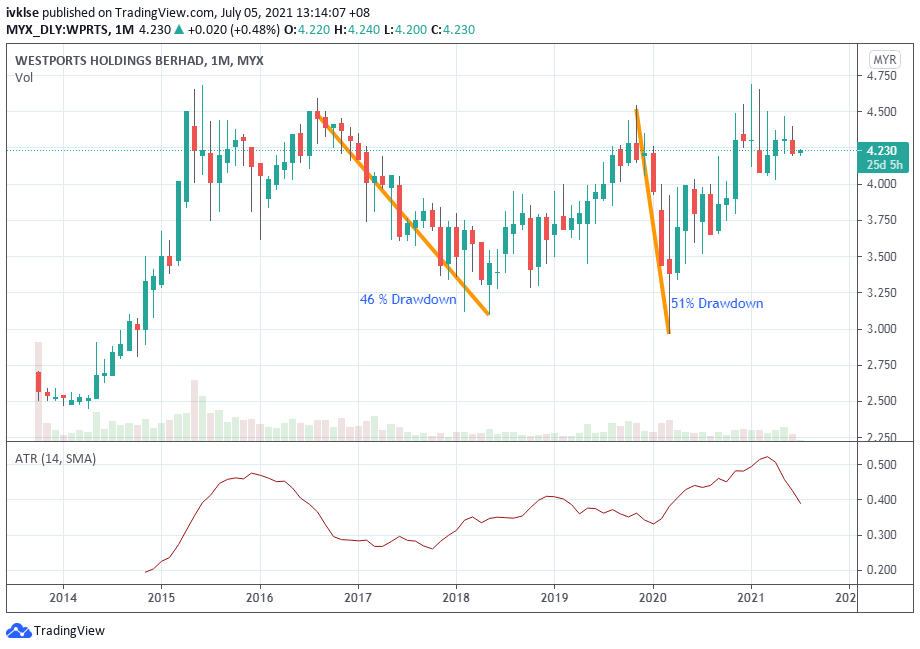
Maximum draw-down for WPRTS is 51 %.
No comments:
Post a Comment