Company Profile
Astro Malaysia Holdings Bhd (ASTRO) is Malaysia leading content and entertainment company.
Astro operate into three main business segment
i) Television
Television segment is a provider of television services including creation, content, aggregation and distribution, magazine publication and distribution and multimedia interactive services.
This is the largest segment of ASTRO contributing 85.74 % of ASTRO 2021 revenue. This segment revenue is reducing at 5 years CAGR of - 5.74 %.
ii) Radio
The radio segment is a provider of radio broadcasting service and media sales service. This segment is mainly affect by Movement Control Order (MCO). For financial period ending 31 January 2021 it revenue had decrease from RM 273,794,000 in 2020 to RM 160,558,000 in 2021, a decrease of 41.36 %.
iii) Home Shopping
This is a relatively new segment of ASTRO business as compared to the other two segments. It operates home shopping business through various platforms including but not limited to TV, internet/ online shopping and mobile shopping. Its 5 years CAGR is 12.01 % and it is in profit for the first time in 2021.
Income Statement
With more producer companies; ie Mediacorp (Singapore), TVB (Hong Kong), etc provide free content to the public through online video sharing platform like youtube, ASTRO revenue from television would reduce. It had reduced by almost 5% per annual for the past 5 years. ASTRO is trying to change to digital platform and home shopping.
ASTRO 5 years CAGR of net profit also reduced at -3.07 %.
Balance Sheet
ASTRO had high goodwill and intangible assets mainly due to the right of use of satellite transponders. Besides that ASTRO is in high gearing business with the debt ratio of 0.59 in 2021. From 2017 to 2020 three term loan which are RM 300,000,000 in 2020, RM 300,000,000 in 2018 and USD150,000 in 2017.
ASTRO has low current ratio. ASTRO cash / current asset has increase over the year from 38.18 % in 2017 to 63.57 % in 2021.
Cash Flow
5 year CAGR of Cash Flow from Operation is -2.28 % and 5 years CAGR of free cash flow also decreases by -1.73 %.
Per Share Analysis
ASTRO price had drop significantly with 5 years CAGR of -21.55 %. Its P/E had go below 10 in 2020. ASTRO had negative BV/Share due to high intangible assets.
ASTRO had a performance share award (PSU) which would reward its director and employee for good performance base on 3 years performance period 2021,2022 and 2023 which account for 18,281,900 shares, 0.35 % of the share. The PSU able to align the director and employee to the performance of ASTRO. According to the previous PSU only 35.35 % is rewarded.
Dividend
ASTRO had high dividend yield which is higher than 10 year Malaysia Government Bond which use as reference as risk free rate. However ASTRO had high dividend payout ratio with two years 2019 and 2017 larger than 100 %. This mean ASTRO is paying its shareholder more dividend than its earning.
Research Report
Peer Analysis
ASTRO has low P/E and high dividend yield compared to its international competitor. Aside EchoStar Corporation which had lower debt ratio, other companies had high debt ratio.
Technical Analysis
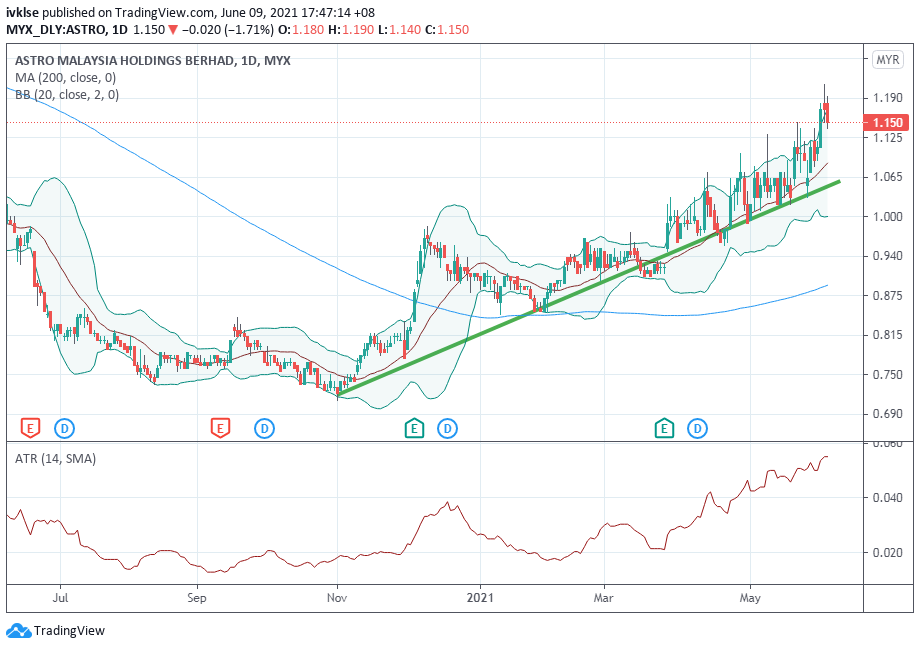
ASTRO daily chart show an upward trench.
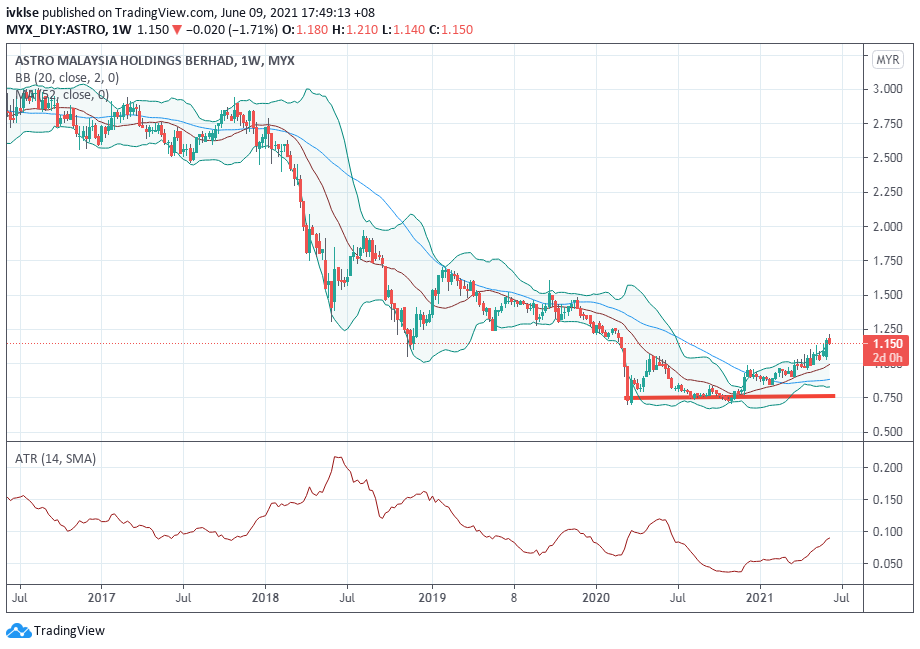
ASTRO weekly chart also shows reversal with the support level at RM 0.75.
No comments:
Post a Comment