Company Profile
Rexit Berhad (REXIT) is a company that focuses on delivering solutions and services to Financial Service Sector particularly the General Insurance Industry.
REXIT had three product namely:-
e-Cover - Enabling online insurance transaction
Provides electronic link between insurance companies and Malaysia Road Transport Department (“JPJ”)
Manage and operate the my Salam portal for eligible members, on 29 July 2019 amended agreement was signed to a five year term subject to regulatory authority approval. Initial approval from 1 January 2019 to 31 December 2020 further extension for 2 years after expiry.
e-PPA - Enabling online unit trust investment through EPF
Industry platform for submission of unit trust investment and redemption applications which are settled electronically using the EPF member’s contribution.
InfoGuardian - Enabling online legal documentation
Is an integrated workflow, case management and document management system specially designed for financial and legal services industries, to provide and facilitate an online information sharing environment for multiple users within and outside customer organication
One local bank (RHB Bank) and international bank (Al Rajhi Bank) together with their panel of legal firms and property valuation firms is using the service.
Income Statement

REXIT revenue and net profit had increased steadily for the past five years. However after look in the 2020 annual report there is no revenue recognised at the point in time for year 2020. Revenue recorded in the income statement would only be recognised in the future.There is a risk that the customer is unable to pay to REXIT in the future.
Asides that, 3 major customers had contributed 48.91 % of its 2020 revenue. REXIT is mainly focus in 2 countries Malaysia and Hong Kong, 81.20 % of REXIT 2020 revenue are from customers located in Malaysia while Hong Kong customers contributed 16.43 % of the revenue.
Balance Sheet
In 2019 there is a significant increase in account receivable from RM 2,734,900 in 2018 to RM 5,250,035 in 2019 91.96 % increase mainly due to the My Salam Portal. However the percentage of account receivable past due had also increase to 68.76 % in 2019 from 18.95 in 2018. In 2020, 76 % of account receivable are from 4 major customers.
REXIT had high current ratio and high cash / current asset ratio. In 2020 there is an decrease in cash / current asset ratio mainly because REXIT had invested in other investment which the management would like to hold for a longer term instead of cash fund. For the financial year ending 30 June 2020, RM 17,932,000 had invested into the other investment and only receive RM 63,216 dividend from the investment. Base on Quarter 3 2021 report, the investment had increase its value to RM 18,775,000, 4.7 % increase. This unrealized gain would be recorded in other comprehensive income hence it would not effect the nett profit of REXIT.
Cash Flow
REXIT had negative growth for cash flow from operation and free cash flow. Asides that, REXIT had constantly repurchased back its own share, in 2020 RM 865,728 had been spent for share repurchase and 15,071,500 shares (7.96 %) are held as treasury shares.
Per Share Analysis
REXIT had low P/E ratio. REXIT price is 2.54 times higher than its BV.
Dividend
REXIT had high dividend yield higher than 10 year Malaysia Government Bond. For financial year 2021 REXIT had pay out RM 0.04 dividend.
Research Report
No recent research report
Peer Analysis
REXIT has a high dividend yield compared to others.
Technical Analysis
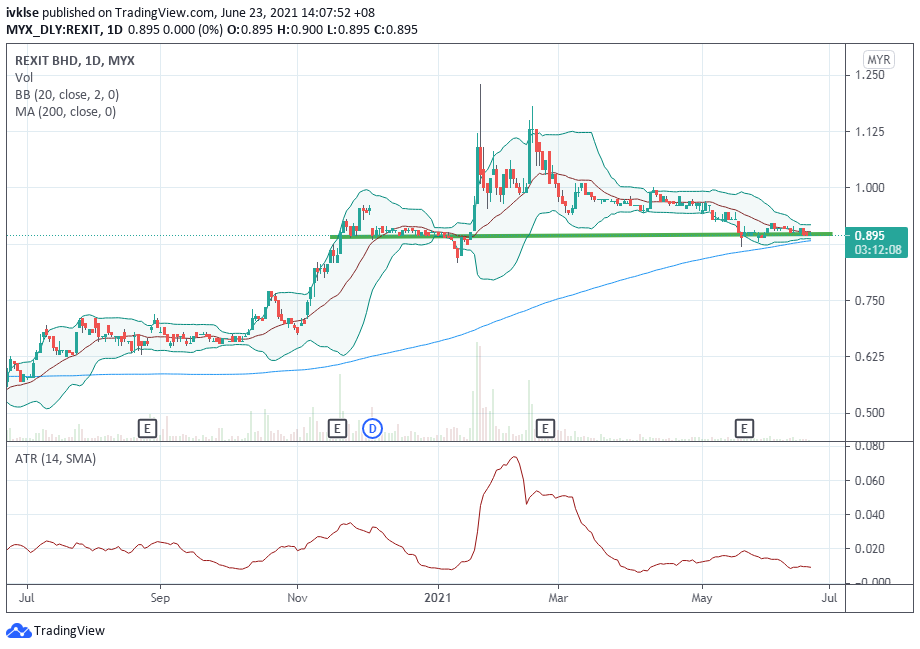
REXIT daily chart shows consolidation at 0.89.
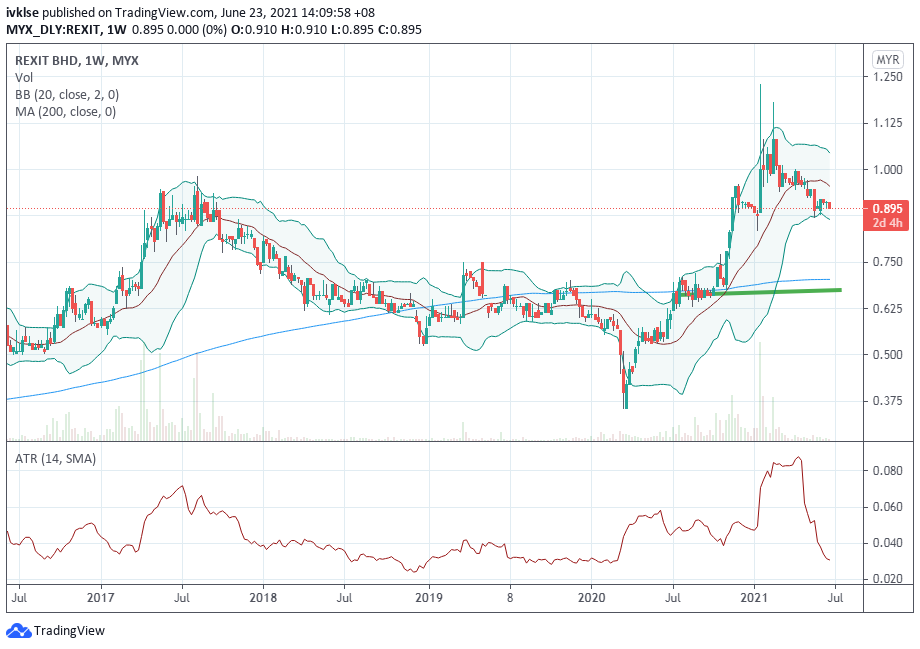
Weekly chart show downward trend with support at RM 0.63.
No comments:
Post a Comment