Company Profile
Petronas Chemicals Group Bhd (PCHEM) is an integral chemicals producer in Malaysia. PCHEM had a combined production capacity of 12.8 million tonnes per annum from 11 production plantation sites in Malaysia, Netherlands, Canada, Singapore and Germany. In September 2019, PCHEM acquired Da Vinci Group for EUR 163,000,000 which focuses on silicone blending facilities. PCHEM is the largest methanol producer in Asia and 4th largest across the world.
PCHEM is operated in two major business segments:
Olefins and Derivatives
Manufacturing and marketing of wide range of olefin and polymer products, which are as basic feedback for other products, to intermediate product including basic and high performance chemicals
Contribute the largest percentage of revenue in 2020 57.95 %, which had decrease from 70 % in 2016
Unstable profit margin with the range of 24.41 % in 2017 to 3.69 % in 2020
Profit highly correlated with crude oil price. Profit increase with crude oil price
Fertilisers and Methanol
Manufacturing and marketing methanol and range of nitrogen, phosphate and compound fertiliser.
Contribute 36.98 % revenue in 2020
More stable income, profit margin around 25 %
Income Statement
PCHEM nett profit had drop significantly from RM 2,795,000,000 in 2019 to RM 1,586,000,000 in 2020, a decrease of 43.26 % compared to revenue which dropped 12.27 %. This is mainly due to the low crude oil price in 2020 which will affect the profit margin of Olefins and Derivative segment from 11.82 % in 2019 to 3.69 % in 2020. Q1 2021 showed an increase in the Olefin and Derivative segment profit due to improvement of the crude oil price. Q1 2021 show the highest profit margin for both operating segments since Q2 2018.

Aside year 2020 which was caused by the Convid 19 pandemic, PCHEM revenue and profit had dropped in 2019.
Balance Sheet
PCHEM had a low Debt to Equity ratio which means PCHEM balance sheet is healthy and able to sustain for long term. Aside from that PCHEM current ratio is high and in upward direction since 2017. PCHEM is also cash rich where 77.03 % of its current asset is cash.
Cash Flow
5 year CAGR of Cash Flow from Operation is -2.28 % mainly due to decrease in nett profit. However the 5 year CAGR of free cash flow is at 23,76 %.
Per Share Analysis
PCHEM price 5 years CAGR increase at 1.26 while the 5 year CAGR of free cash flow is at 23.76 %. In 2020 PCHEM P/E had increase to 37.48 due to lower profit. Despite lower profit in 2020 PCHEM book value per share had increase from RM 3.67 in 2019 to RM 3.71 in 2020, 1.02 % increase.
Dividend
Despite having high dividend payout ratio, PCHEM had lower dividend yield compare to 10 year Malaysia Government Bond.
Research Report
Peer Analysis
PCHEM had higher P/E compared to LUXCHEM and LCTITAN. Asides that PCHEM dividend yield is lower than HEXTAR, KARYON and LUXCHEM.
Technical Analysis

PCHEM daily chart show ascending triangle. If the price able to breakout at price RM 8.35 the price can continue to move up.
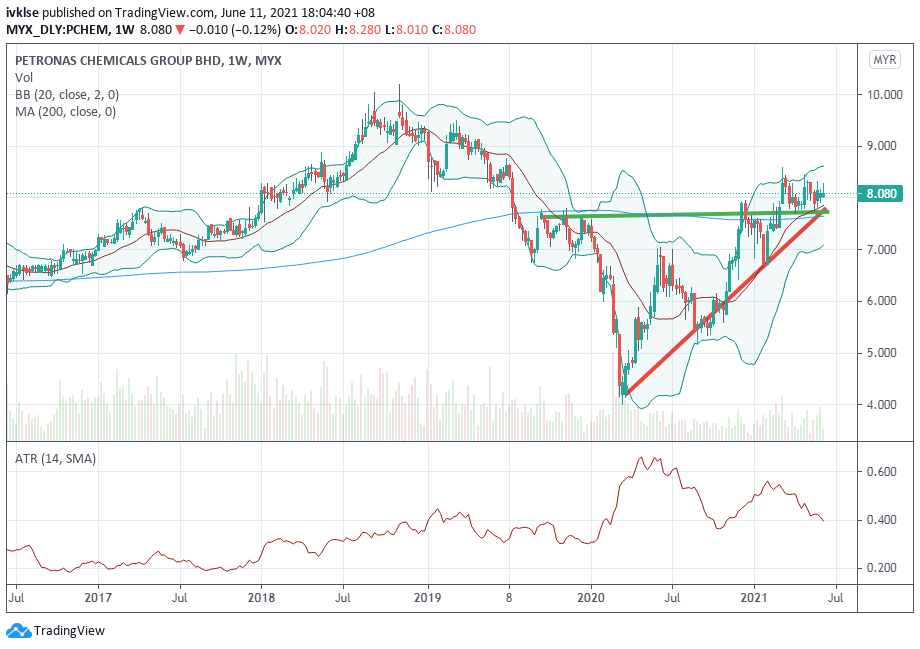
Weekly chart show ascending triangle with the price had break out RM 7.70. Price is might continue upward trend.
No comments:
Post a Comment