Company Profile
Press Metal Aluminium Holdings Berhad (PMETAL) is engaged in the manufacturing and trading of aluminium products. In 2020 PMETAL smelted 760,000 tonnes of aluminium from two smelting plants in Sarawak. Aside from that, PMETAL extruded 210,000 tonnes of aluminium product from two extrusion plants in Klang, Malaysia and Guangzhou, China. Last but not least PMETAL manufactured 120,000 tonnes of aluminium alloy ingots, 240,000 tonnes of aluminium billets and 200,000 tonnes of wire rods.
PMETAL main raw materials are carbon anode and alumina. In January 2018 PMETAL acquired 20 % of Shandong Sunstone & PMB Carbon Ltd. Co which produce carbon anode. PMETAL also acquired 50 % equity in Japan Alumina Associates (Australia) Pty. Ltd in 2019 and 25 % of PT Bintan Alumina Indonesia in 2020. Both companies able to produce 80 % of alumina required by PMETAL.
On 30 March 2018 PMETAL acquired Leader Universal Aluminium Sdn Bhd which is aluminium wire rod producer for RM 96,000,000. With the increasing price of copper more electrical cable had changed to aluminium cable made from wire rods.
PMETAL had three operating segments:
1)Smelting and Extrusion
Manufacturing and trading smelting and extrusion products
87% of 2020 revenue
Highest profit margin and return of asset segment
22 % of segment revenue are from one major customer, Sumitomo Corporation Asia and Oceania Pte. Ltd.
2) Trading
3) Refinery
Income Statement
In thousands | 31 Dec 2020 | 31 Dec 2019 | 31 Dec 2018 | 31 Dec 2017 | 31 Dec 2016 |
Revenue | 7,476,320 | 8,804,570 | 9,170,120 | 8,176,130 | 6,649,450 |
Cost of Goods Sales | 6,358,650 | 7,569,850 | 7,812,030 | 6,776,420 | 5,590,420 |
Earning Before Tax | 654,650 | 631,220 | 870,450 | 808,750 | 674,830 |
Nett Profit | 586,910 | 581,680 | 772,870 | 746,440 | 605,770 |
5 Years CAGR of Revenue | 2.37 % |
5 years CAGR of Nett Profit | -0.63 % |

PMETAL revenue had increased from 2016 to 2018 however in 2019 there is a drop in revenue mainly due to lower aluminium price saw a decrease of profit margin from 13 % in 2018 to 9.96 % 2019. In 2020 recovery of aluminium price, profit margin had increased back to 12.01 % in 2020. Q1 2021 saw an increase of revenue as the recovery of aluminium price.
Balance Sheet
In Thousands | 31 Dec 2020 | 31 Dec 2019 | 31 Dec 2018 | 31 Dec 2017 | 31 Dec 2016 |
Debt | 5,148,410 | 3,861,000 | 3,302,220 | 2,821,740 | 2,381,540 |
Debt to Equity | 1.29 | 1.05 | 0.92 | 1.38 | 1.53 |
Current Ratio | 1.20 | 1.88 | 1.58 | 1.36 | 0.77 |
Cash / Current Asset | 16.05 % | 12.12 % | 5.88 % | 7.61 % | 13.13 % |
In 2020 PMETAL had an increase its Debt from RM 3,861,000,000 in 2019 to 5,148,410,000 in 2020 increase by 33.34 %. In August 2020, the company made its second issuance of the Sukuk Programme with nominal value RM 700,000,000. PMETAL has a current ratio higher than 1.0. In 2020 PMETAL cash / current assets had increased from 12.12 % in 2019 to 16.05 % in 2020.
Cash Flow
In Thousands | 31 Dec 2020 | 31 Dec 2019 | 31 Dec 2018 | 31 Dec 2017 | 31 Dec 2016 |
Cash Flow from Operation | 1,387,760 | 1,459,440 | 1,109,860 | 393,970 | 936,400 |
Cash Flow from Investing | -2,033,690 | -1,187,680 | -451,630 | -168,760 | -451,260 |
Cash Flow from Financing | 879,510 | -101,630 | -691,810 | -318,230 | -410,210 |
Free Cash Flow | 237,000 | 728,130 | 817,150 | 207,250 | 511,650 |
5 years CAGR of Cash Flow from Operation | 8.19 % |
5 years CAGR of Free Cash Flow | -14.27 |
PMETAL had positive cash flow from financing in 2020 due to drawdown of multiple loans from banks. Aside from that in 2019 and 2020, PMETAL had made large capital investments by acquired companies. Hence the free cash flow for the year 2020 had reduced significantly.
Per Share Analysis
| 31 Dec 2020 | 31 Dec 2019 | 31 Dec 2018 | 31 Dec 2017 | 31 Dec 2016 |
Share Outstanding | 8,076,220,000 | 8,076,220,000 | 7,901,690,000 | 7,665,560,000 | 7,395,780,000 |
Adjusted Price 31 Dec | 4.195 | 2.325 | 2.415 | 2.695 | 0.795 |
BV/Share | 0.49 | 0.45 | 0.40 | 0.29 | 0.30 |
P/E | 57.72 | 32.28 | 24.69 | 27.68 | 9.71 |
5 years CAGR of Price | 39.47 |
PMETAL price had adjusted with the bonus issue in April 2021. PMETAL had a high P/E value and increased over the year. PMETAL 5 years CAGR of price is 39.47 % despite the CAGR of free cash flow is -14.27 %.
Dividend
| 31 Dec 2020 | 31 Dec 2019 | 31 Dec 2018 | 31 Dec 2017 | 31 Dec 2016 |
Adjusted Dividend Per Share | 0.02125 | 0.025 | 0.0325 | 0.03 | 0.02 |
Dividend Payout | 29.24 % | 34.71 % | 33.23 % | 30.81 % | 24.42 % |
Dividend Yield | 0.51 % | 1.08 % | 1.35 % | 1.11 % | 2.52 % |
10 year Malaysia Government Bond | 2.68 % | 3.33 % | 4.01 % | 3.94 % | 4.24 % |
PCHEM had low dividend yield as compared to 10 year Malaysia Government Bond
Research Report
Investment House | Date | Target Price |
HONG LEONG INVESTMENT BANK | 28 MAY 2021 | RM 7.10 |
KENAGA INVESTMENT BANK BHD | 28 MAY 2021 | RM 6.50 |
Average Price Target |
| RM 6.80 |
Peer Analysis
| PMETAL | ALCOM | ARANK | LBALUM | PA |
P/E | 68.89 | 9.07 | 13.05 | 12.00 | 25.98 |
Dividend Yield | 0.45 % | 0 % | 3.28 % | 1.06 % | 1.18 % |
PMETAL had high P/E and low dividend yield compare to other peers.
Technical Analysis
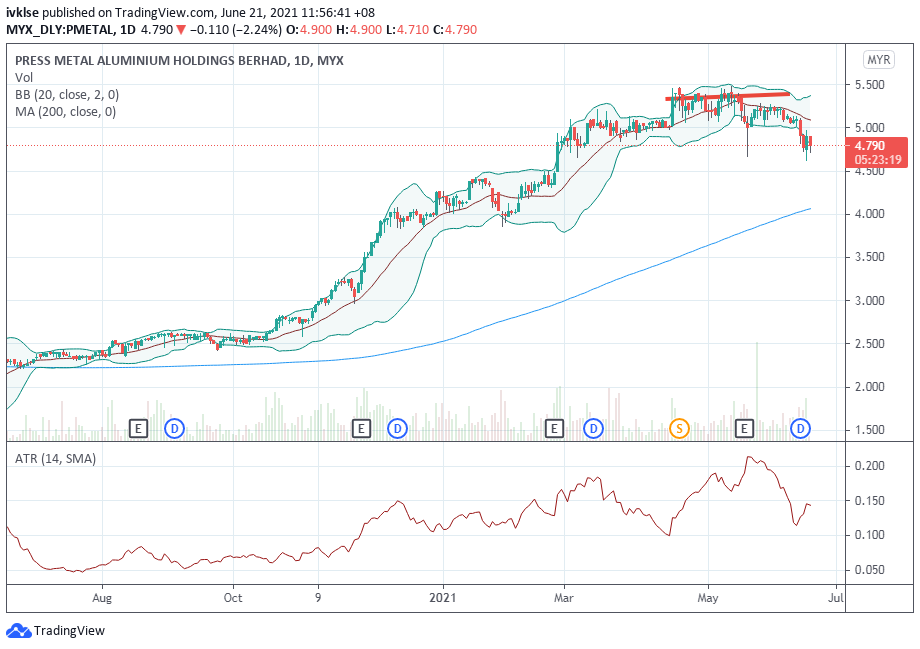
PMETAL daily chart show retrenchment from upward trend with support level at RM 4 and resistance level at 5.3.

Weekly chart show downward trend with support at RM 4.00 and resistance at RM 5.3.